CRM - Statistics & Reporting
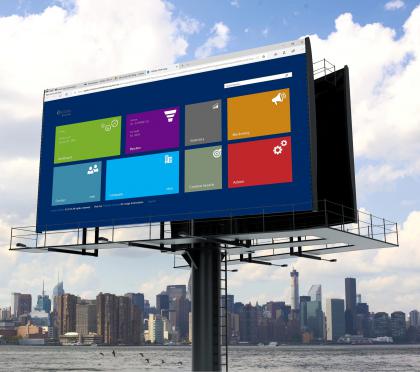
REAL-TIME VISIBILITY WITH IGLOBE CRM
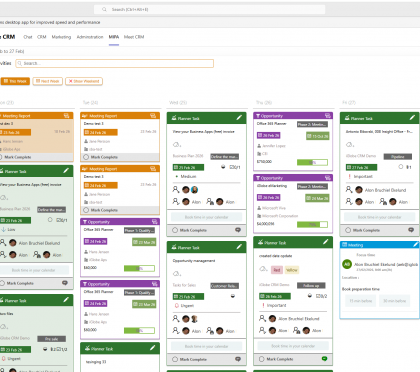
Want to forecast sales better, hit that record sales target, and increase profitability per sale? How about providing users with a dashboard-based navigation to find exactly the customers group the want to target? Or a simply and quick overview of the meeting reports they need to follow up on? Choosing between 12 interactive dashboards you can implement exactly the dashboards that add value to your version of iGlobe CRM Office 365.
IN GENERAL.
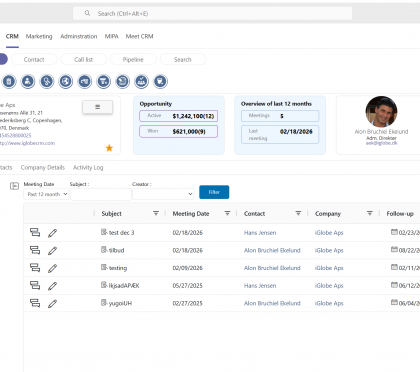
Your top 10 CRM customers. Top contributors among your sales rep and the meeting activity among the sales rep. All this you can see directly in the dashboard. Just One Click will do the trick. With iGlobe CRM Solution for Office 365, you do not have to settle with a specific number of reports or spent money on developing new or special reports. iGlobe is a part of your Office, hence also tightly integrated to Excel. Use the tool you like, Excel, and get exactly the report you need at any time any where.
WHY REPORTING.
Get a better understanding of you customers and act proactive. How is the sales this year compare to last year. What they are buying and how loyal they are? Whom do we communicate most with? Which one of your sales rep. is most active? How often do we meet our customers? Are our customers satisfied? What are their expectation to the future? How do we segment our customers? Moreover, how is the sale in these segments? We can go on and on. Most important the reporting tool must be dynamic and easy to customize and adjust on the fly.
FOR THE CEO.
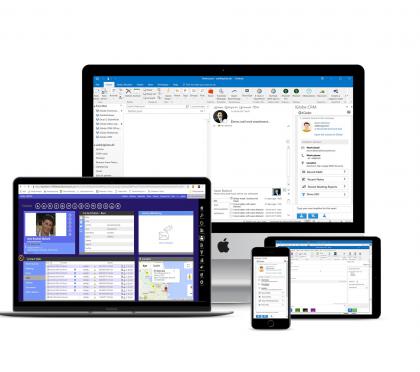
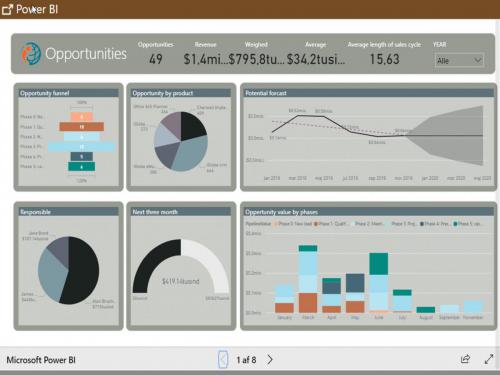
Reporting is all about getting a simple, better, and accurate overview of your CRM data. It most be a simple tool that can be used both within and outside the CRM system. Why should the CEO open the CRM system? Information and reports must be available at the CEO’s hand any time, in real time at the executive intranet in Office 365. That where the CEO have all other information. Using Excel to create you CRM reports and Office web-apps to present it in SharePoint Online you have a unique Business Intelligent tool. If this isn’t enough Office 365 Power BI will most defiantly do the trick.
iGlob provide a dynamic and flexible reporting tool
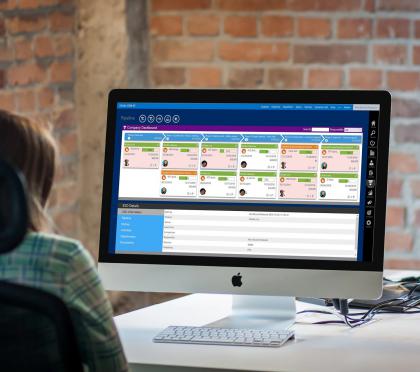
"CRM’s Reporting tool gives a current, comprehensive view of all sales activities. You know where every customer is in the sales cycle, deal size, contact history, even competitor information to help craft more effective messaging. Dynamic Reports & Dashboards provide an easy, accurate read of everything going on."
Alon Ekelund iGlobe
GETTING STARTED & SUPPORT
Important! Before you can use these Power BI report you must have a fully functional iGlobe CRM Office 365 App deployed on your tenant.
You will need to connect the solution to your iGlobe CRM App on your tenant. As an iGlobe CRM users you already know that we will need the same URL we always when connecting to the CRM App. Open iGlobe CRM Office 365 and copy the URL from https util “pages” it will look like this example https://YOURDOMIAN-9343dce445fe89.sharepoint.com/sites/SITENAME/IGlobeCRM
Please contact iGlobe for additional information and assistance with implementing or customizing these Power BI report
- Send an e-mail to support@iglobe.dk or sales@iglobe.dk
- You can also get more information in iGlobe CRM Yammer community. Notice it requires that you are invited to the community. If you are not a memebr of iGlobe CRM Yammer community, please send a request to sales@iglobe.dk